Software I have developed
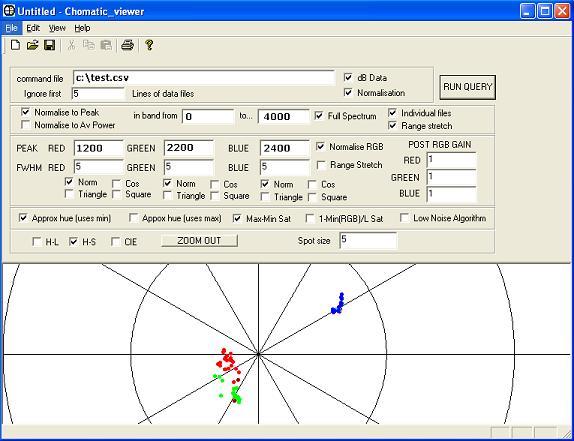
Chromatic viewer software
This software allows complex data sets from instrumentation such as mass spectrometers to be compared for similarity. It uses patented analysis techniques developed by Liverpool University to reveal emerging patterns in the data that are normally obscured or difficult to detect. The patterns are displayed graphically in several formats and several parameters can be altered to help tease out more information.
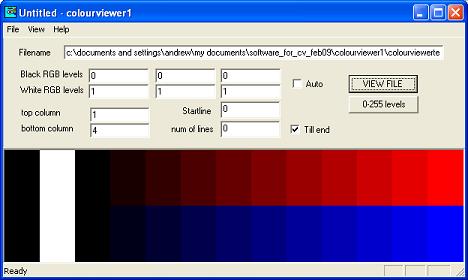
Colour viewer software
This is a simple application to allow RGB colour data gathered by instrumentation to be displayed graphically so it can be compared to another set of RGB data.
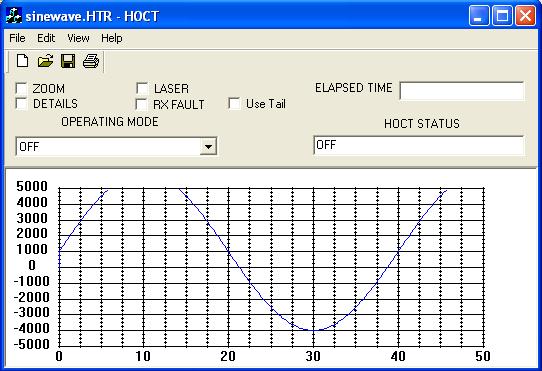
HOCT software
This application was one of several used to controlled the hybrid optical current transformer (HOCT) developed at Liverpool University. Information received from the sensor was displayed on the graphical user interface.
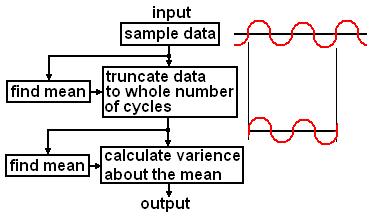
Harmonic analysis software
This application examined sample data and extracted the fundamental frequency of the signal within it. It then applied a best-fit algorithm to fit harmonically related sinusoids to the data. The purpose of this was to determine the exact level of total-harmonic-distortion (THD) occurring in signals from the HOCT and other equipment.
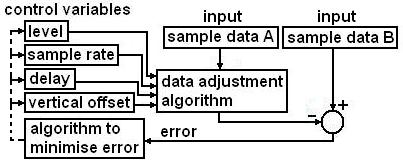
Waveform matching software
The harmonic analysis software was less accurate if small frequency variations were present in the sample data. The sample matching software took sample data recorded on two instruments simultaneously, and then compared these records using a best-fit algorithm to adjust parameters such as sample rate. This was used to compare data obtained from the HOCT with data obtained from precise calibration instrumentation.
Signal level measuring software
This software measured and displayed (in real-time) the level of a sinusoidal signal sent through the HOCT. This allowed levels measured by the HOCT to be compared with other instrumentation.
Frequency distribution software
This software calculated a frequency distribution of a dataset (A list containing the sum of occurrences that fall within a series of equally wide 'range bins'). In addition if a second dataset was provided (with entries linked to the first) this generated a second list of values; each value being mean value of the entries in the second dataset once the first dataset had sub-divided them into each of the 'range bins'. This was used in conjunction with the waveform matching software to determine what type of distortion was present in data from the HOCT.
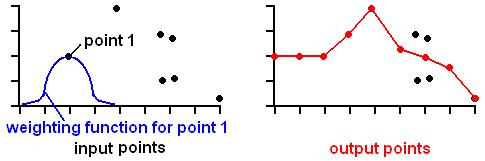
Fuzzy averager software
This software is conceptually similar to that above. Given input data that represents a scattered series of points, the software finds a weighted average for an evenly distributed series of positions along the x-axis. Points in the input data that are closest to the position along the x-axis have more influence on the weighted mean than points that are further away.
Fuzzy averager2 software
This software is conceptually similar to that above, only this time the data is a scattered series of three dimensional coordinates. The software produces a weighted average for an evenly distributed array of positions on the x-y plane. The z-value of coordinates in the input data that are closest to the x-y position are weighted more heavily than those situated further away. One application for this is software is plotting the average pollution level against wind direction and velocity.
Fourier transform software
This software produced a Fourier transform when given a large set of x,y coordinates. It was used to see if anything other than diurnal variations were present in the pollution data gathered during the CATCH project CIMS undertook.
Table lookup software
Given a file containing a series of x,y coordinates and another file containing only x values, this program looked up the x values and translated them into y values. If the x-values fall between entries in the first file than an interpolation method is used to generate the y value.
Chromatic table lookup software
Conceptually similar to the above software, given one file that contains a series of linked pairs of RGB values, and another file that contains a single series of RGB values, this program finds the colour entry in the first file that is the closest match, and then places the RGB value that is linked to it into in the output file. This piece of software can be used to perform colour correction on palettes, or improve the linearity of sensors that work by using colour changes.
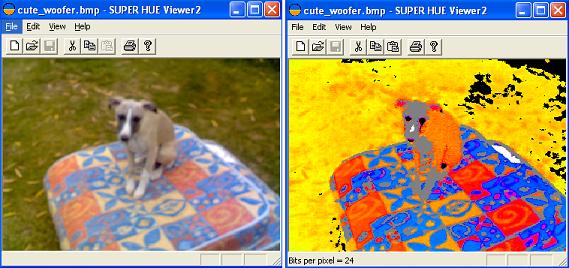
Superhue software
This software was used as a diagnostic tool. It used algorithms developed at Liverpool University to process still images and display the underlying hues. It also allowed the colour of different points in the image to be compared mathematically.
Software developed at home - Just for fun
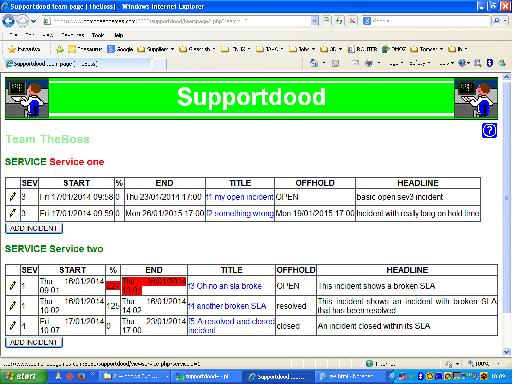
Supportdood
This web application was my first PHP project. It provides timers so support staff can ensure incidents are resolved within their service level agreements (SLAs).
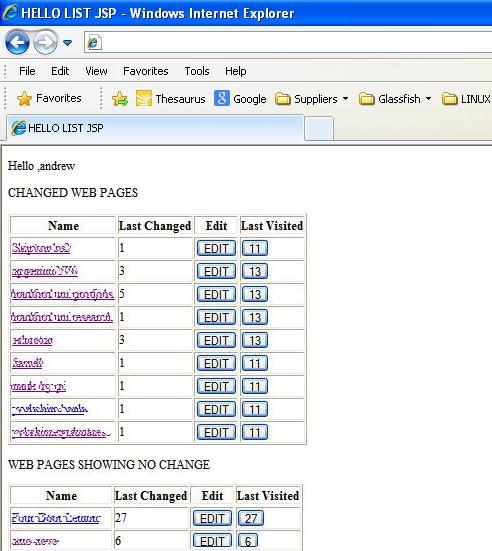
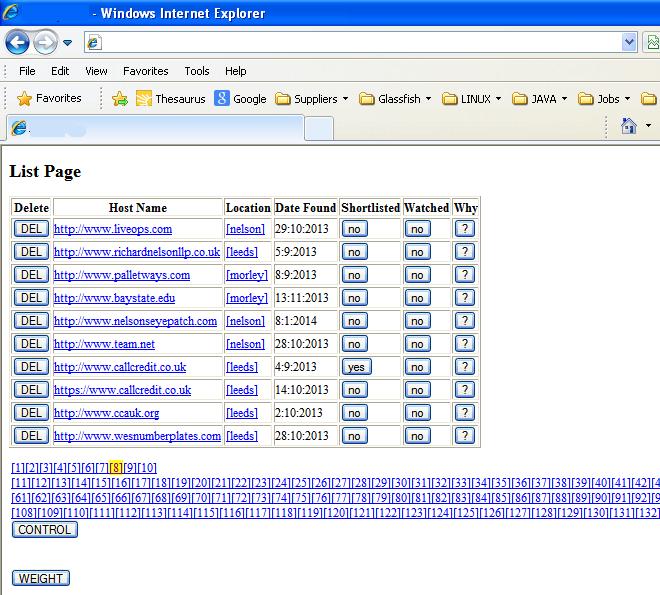
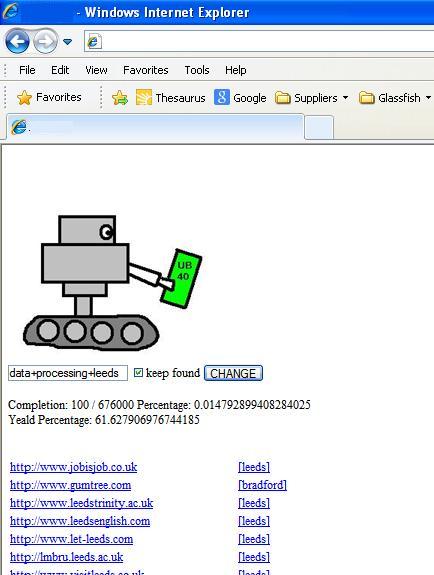
Job searching web applications
Since leaving Detica I have developed three web applications for myself, in order to to help with my search for work. These web applications use J2EE servlet technologies as well as JSP and SQLite.
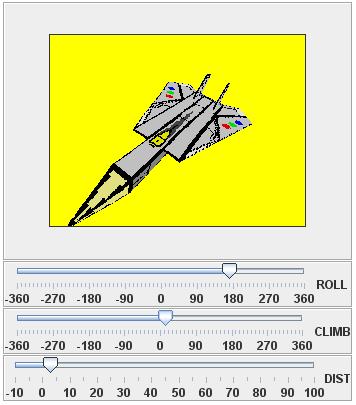
Lightweight 3D engine
This java applet renders 3D objects and allows them to be moved and rotated. It employs a novel technique to minimize the number of floating point divisions needed during rendering.
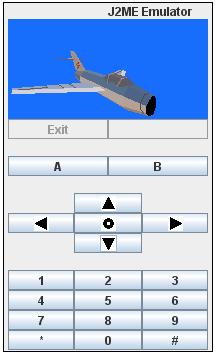
3D engine for non-JSR184 mobiles
This Java Midlet renders 3D objects and allows them to be moved and rotated. It has features for gaming such as reducing detail when the object is far away. It can be run as an applet using a mobile-phone emulator I created using SWING.
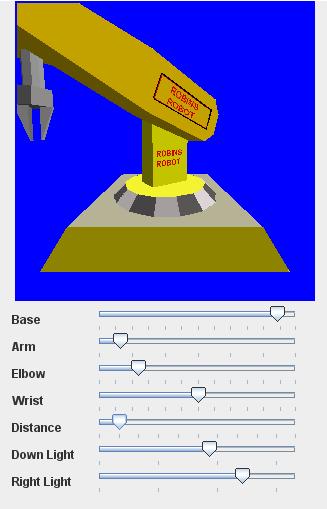
A more advanced 3D engine
Since leaving Detica, I have developed a more advanced JAVA 3D engine with more features such as mouse picking support, scene graph serialization and billboarding.
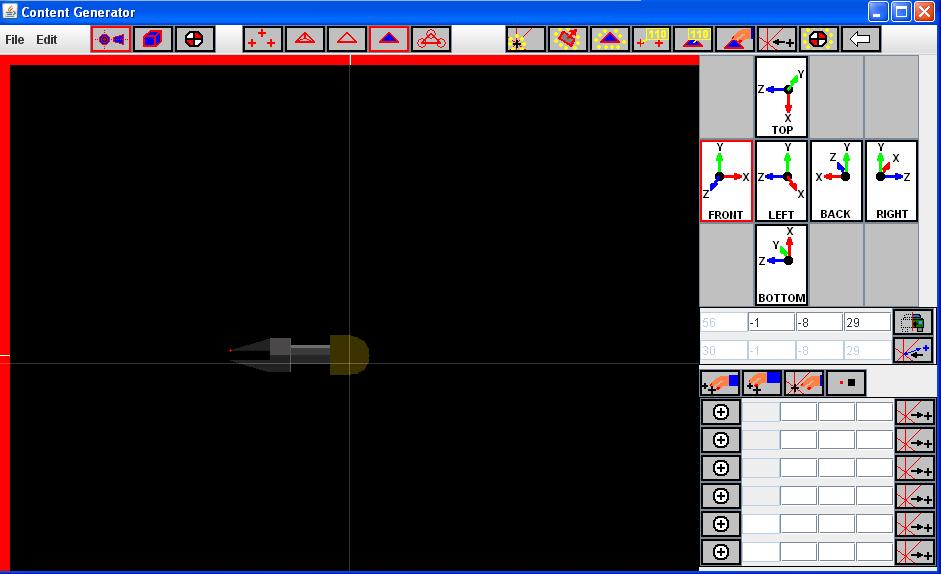
To support this 3D engine I have developed a basic 3D editing suite, so it is relatively easy to generate content for it.
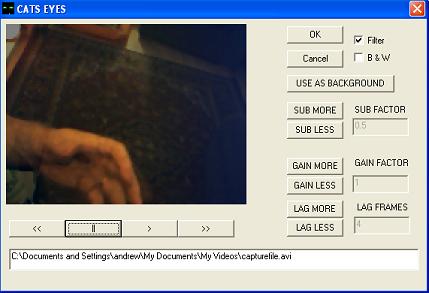
Cats-eyes software
This is software that I developed for myself. It combines together successive frames in a video sequence and also brightens the image. Its purpose is to create useable footage from webcam video-clips taken under dark lighting conditions.
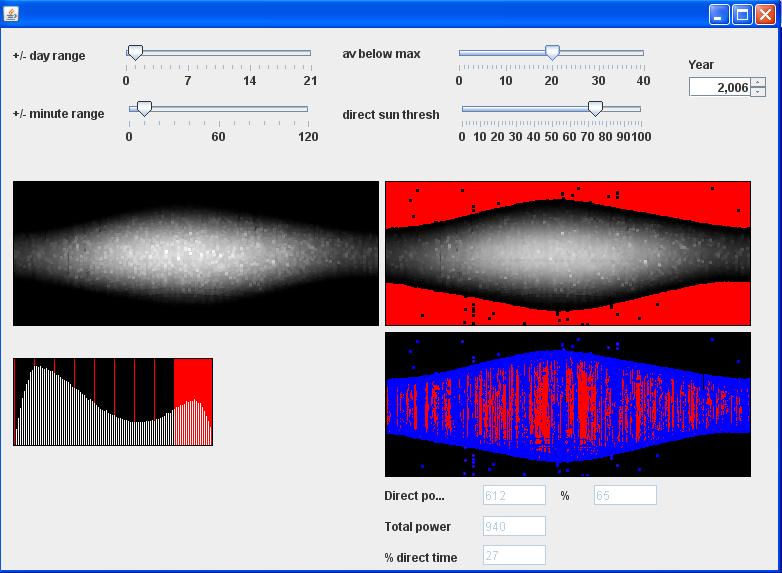
Solar data analysis
This Java application was written to estimate what percentage of solar energy in the UK is direct sunlight, using data from the Proudman Oceanographic Laboratory near Liverpool.
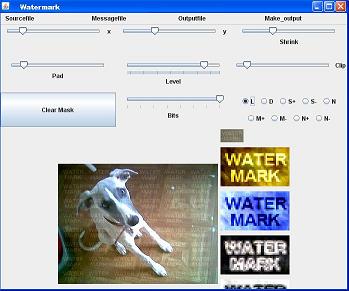
Watermarking images
This Java application was written to add watermarks to images that can be adjusted with SWING sliders
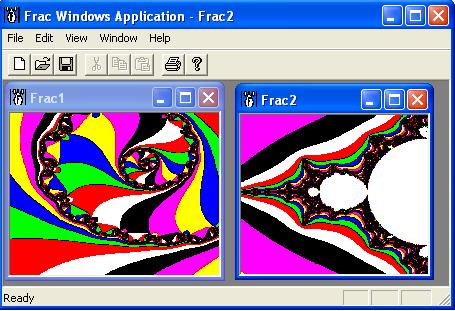
Fractal rendering application
This was the first Visual C++ applications that I wrote back in 1996. It has a multi-document graphical user interface that allows fractals to be created, traversed and edited. It has not really got a commercial application but it looks good.
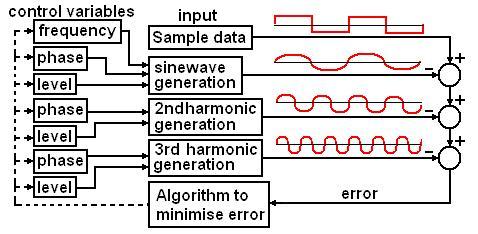
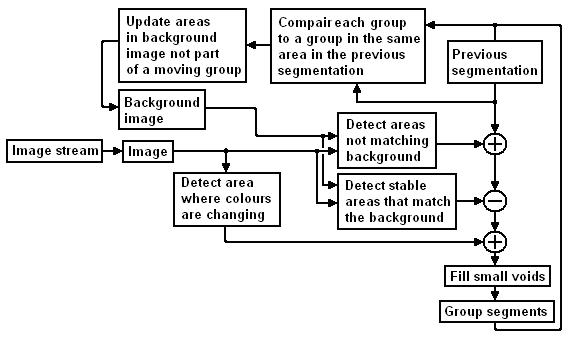
Video separation algorithm
I developed and experimented with video segmentation algorithm shown below (using Visual C++). It is intended to be used to separate moving objects such as people from the rest of the image which is not moving (called the background). Simpler algorithms either do not reliably highlight things that only show slight movement, or highlight stationary things that are placed in the image for excessively long periods. This algorithm quickly assimilates objects into the background image as soon as they become orphaned from objects that are showing movement.
Javascript
Recently I have also been using Javascript and have written a script to generate a sparkler effect
[Click here to visit the sparkler effect javascript page]